Productivity
The 12-Month Inversion: How AI Became Retail's Most Valuable Visitor

Rishan Chopra
Founder
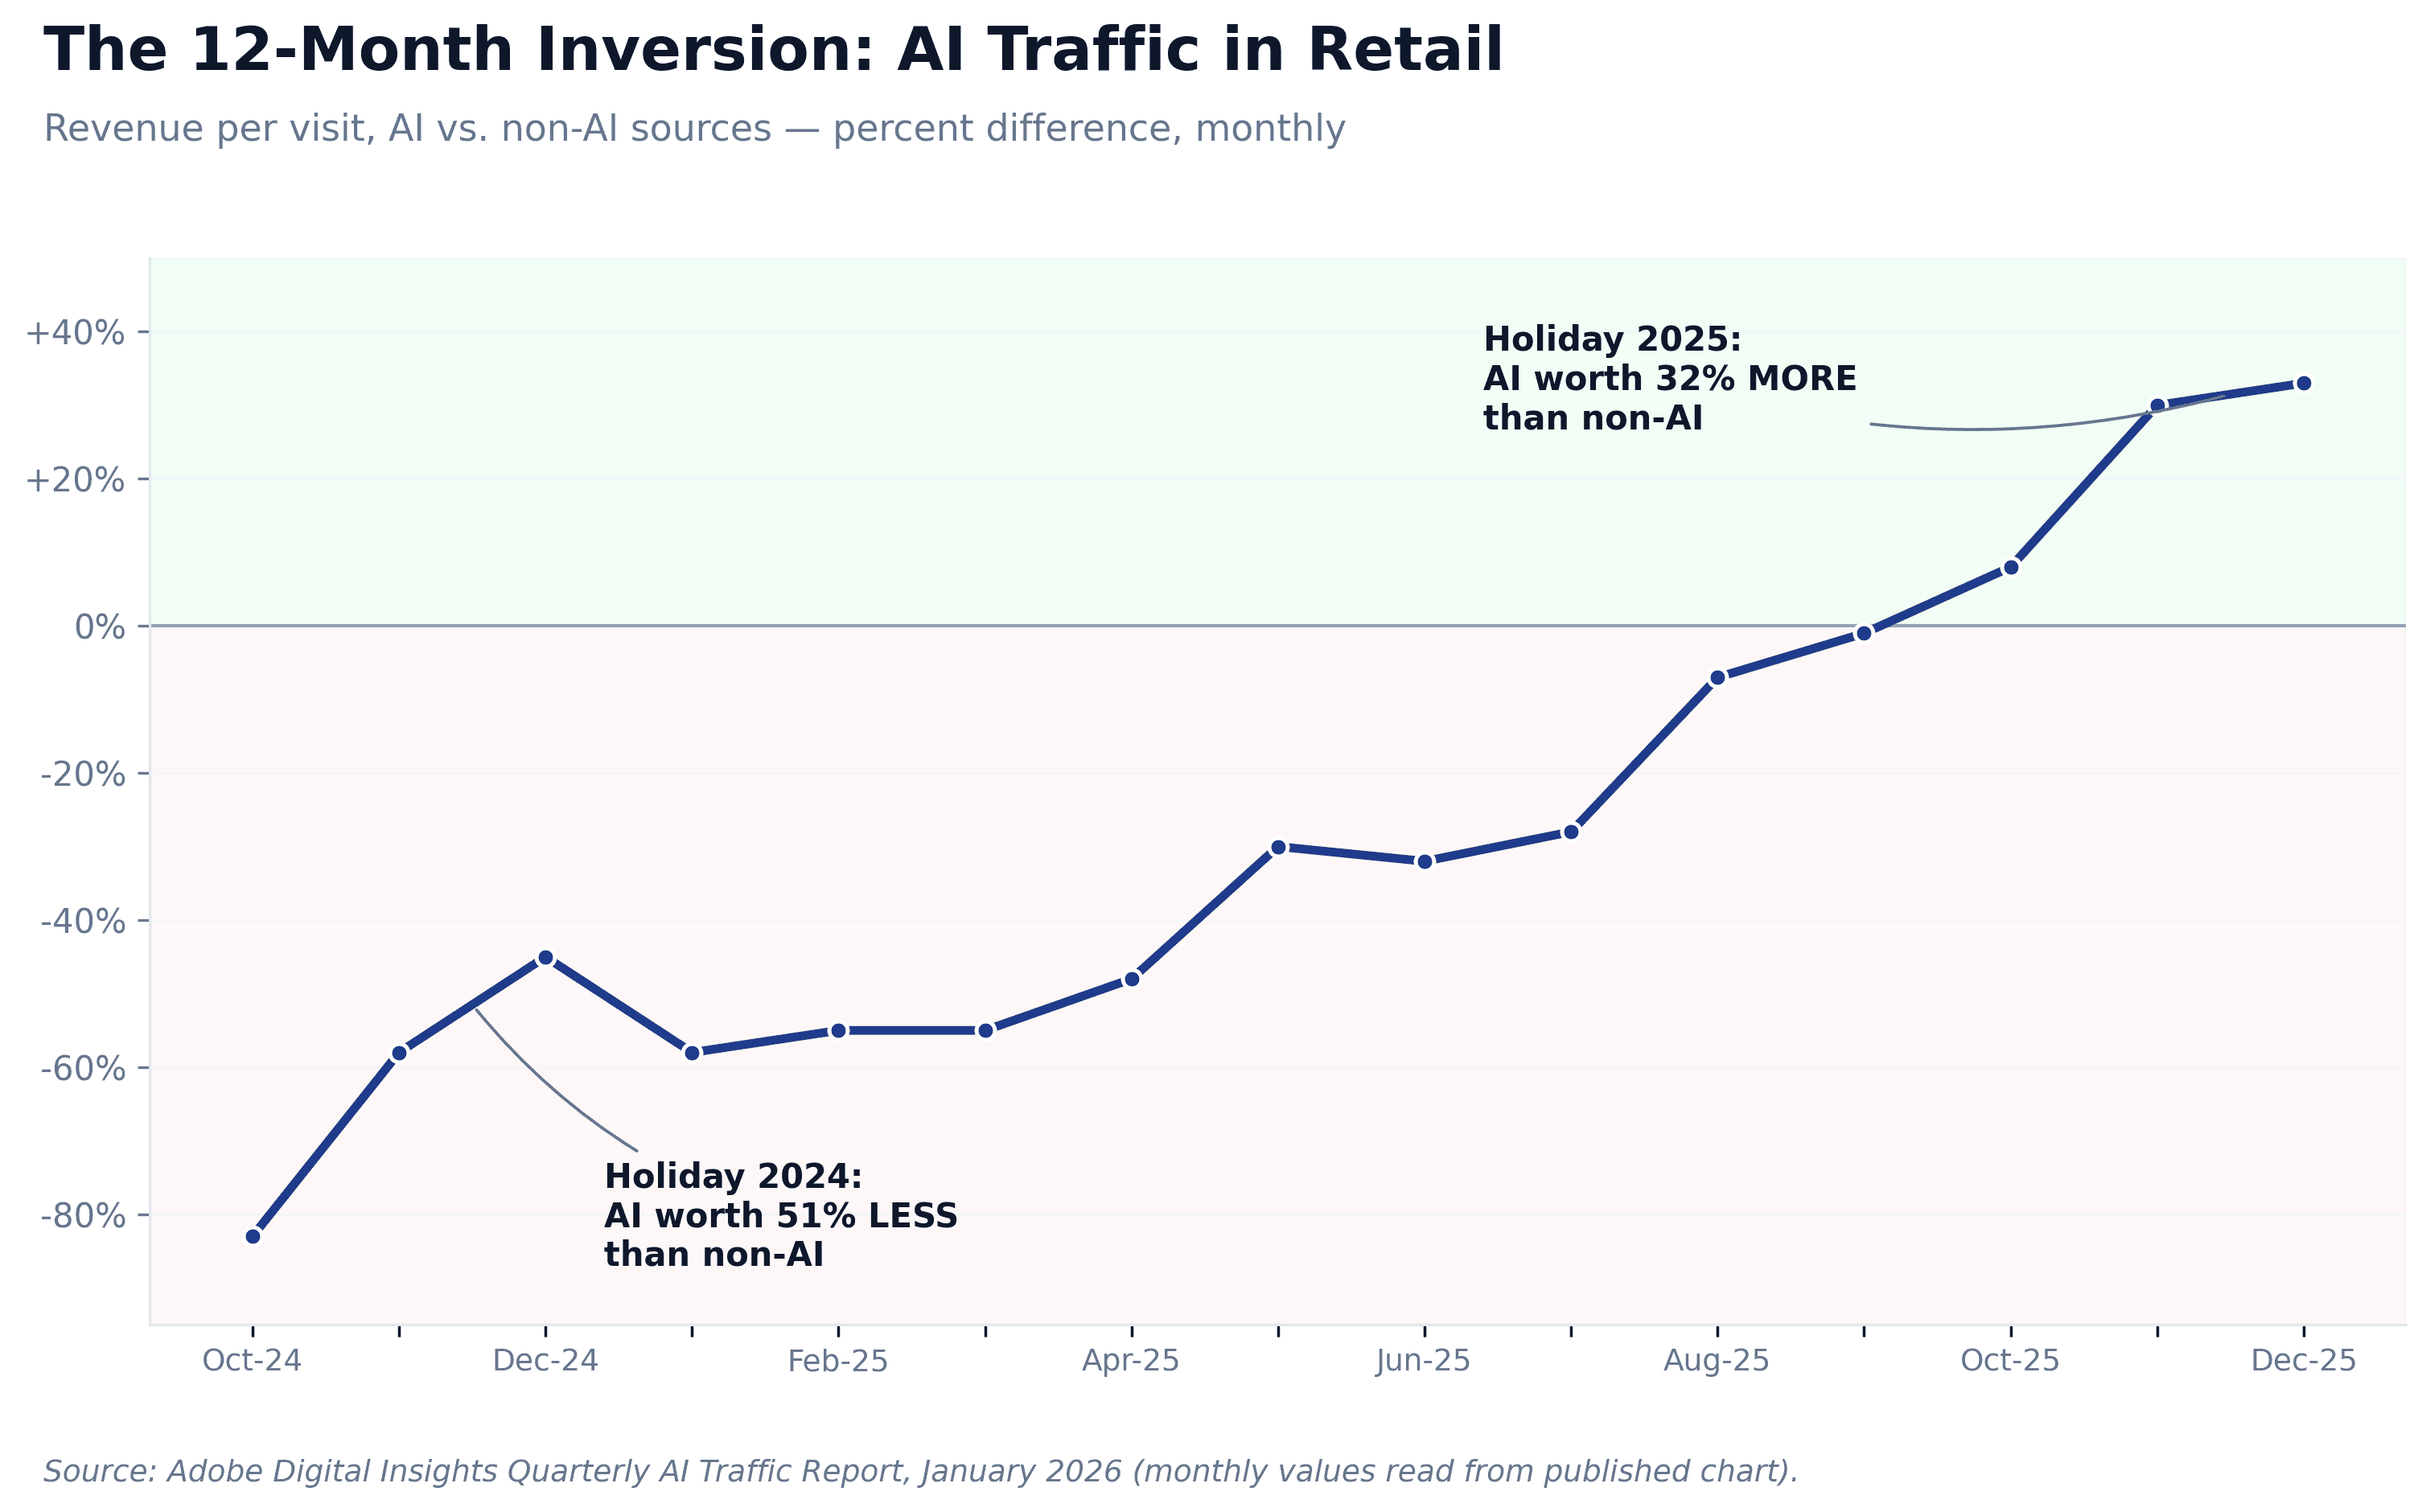
In October 2024, an AI-referred visit to a U.S. retail site was the worst kind of traffic a marketer could buy. It converted lower than every other channel on the dashboard. The revenue per visit was, depending on the week, between 75% and 85% below what a non-AI visit was worth. If you'd ranked every traffic source by economic value, AI would have been at the bottom. Most retail teams that had configured a view of AI-referred sessions in GA4 looked at the numbers, decided the cohort was too small and too unprofitable to matter, and quietly stopped checking.
Twelve months later, that same AI-referred visit is the most valuable visitor a U.S. retailer is acquiring.
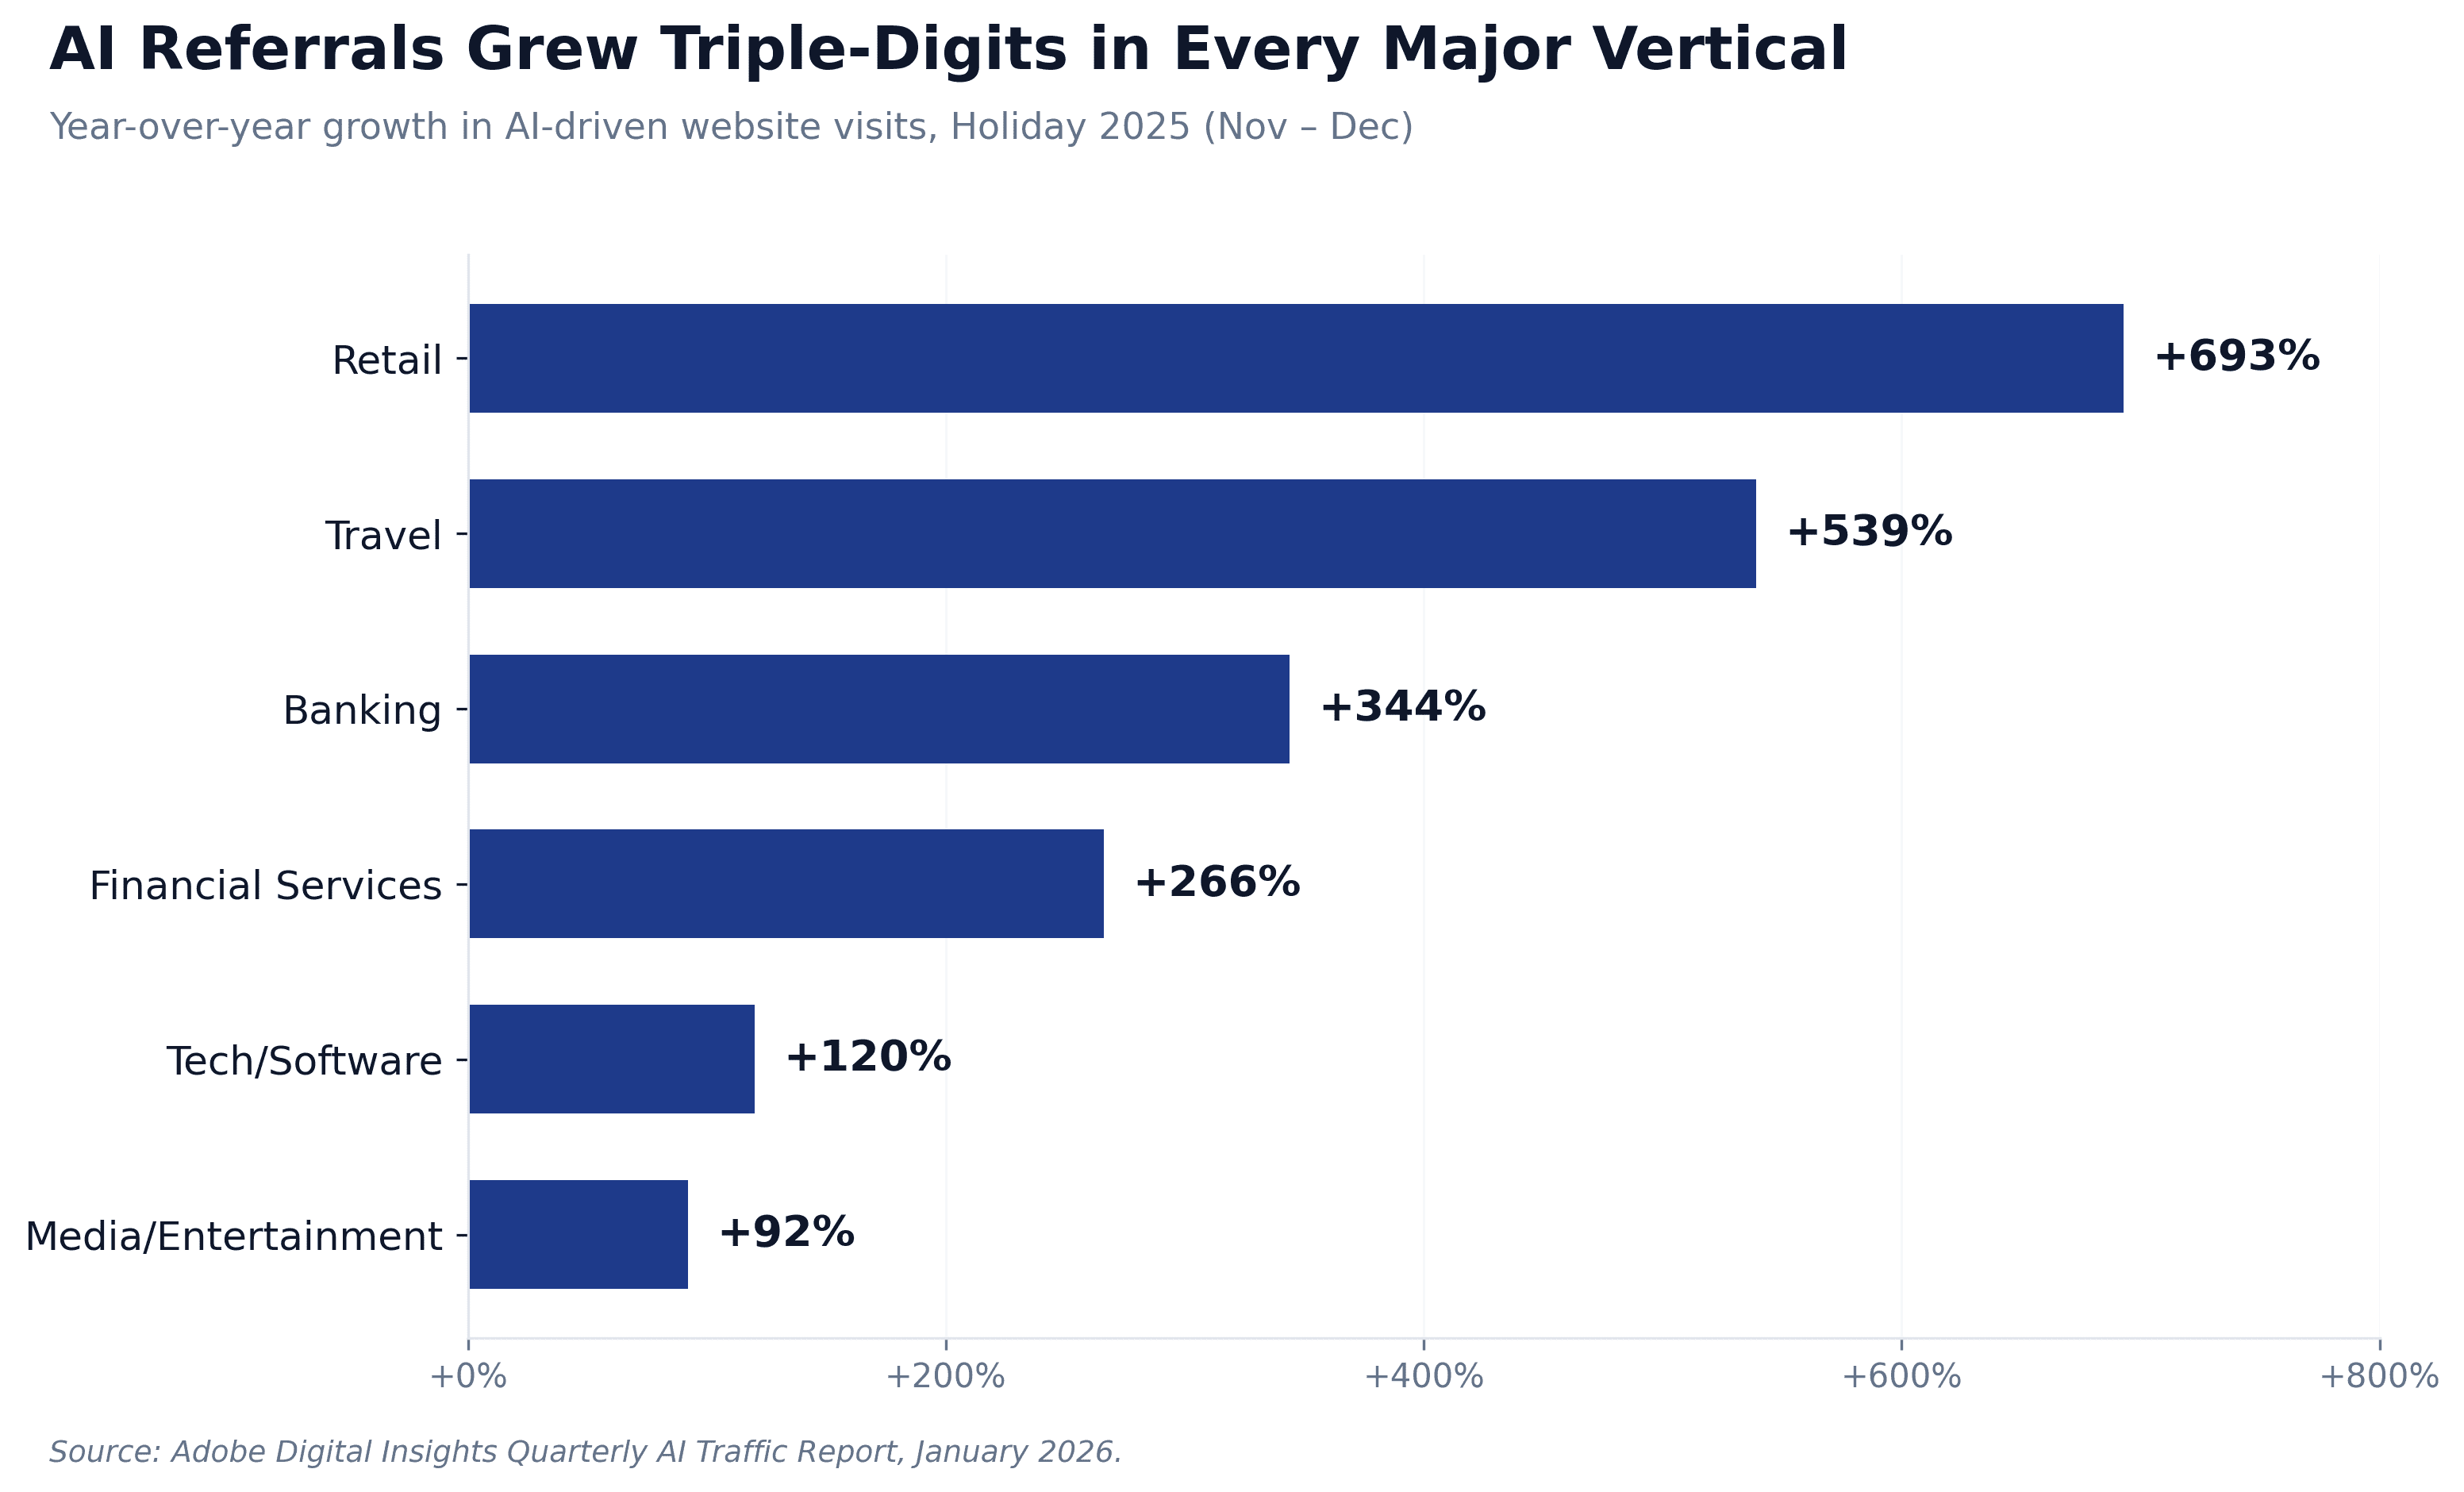
This past holiday season, AI traffic converted 31% higher than non-AI sources. On Thanksgiving the gap was 54%. On Black Friday, 38%. Revenue per visit ran 32% higher. Time on site was 45% longer. Page views per visit were 13% higher. Bounce rate was 33% lower. And the volume of AI traffic itself grew 693% year-over-year during the November–December window — with November alone up 769%.
A 12-month, 83-percentage-point swing in the relative revenue value of a traffic source is, to my knowledge, the largest single-year movement in traffic economics retail measurement has ever recorded. It is the seismic event Adobe's January 2026 Quarterly AI Traffic Report describes — and it is the central exhibit in the argument I want to make in this post, which is the second in a series on AI traffic and the paid-marketing infrastructure that needs to evolve around it.
If Part 1 of this series argued that AI traffic is already in your dashboard but not where you're looking, this post is where we walk into the warehouse and look at what's actually on the pallets. For retail, the warehouse turns out to be unusually well-stocked.
The Curve Most Dashboards Don't Surface
The shape of the retail AI traffic curve, as Adobe charts it, is the kind of growth curve you mostly see in venture pitch decks and don't believe.
Cumulative growth in AI-driven retail visit share since January 2025: +527%. Monthly growth rate consistently in the high double digits and triple digits throughout 2025. November 2025: +769% year-over-year. December 2025: +673% year-over-year. The chart spends the first half of the year compounding from a small base, then accelerates sharply through Q3, then explodes through the holiday window.
For perspective, here is what is not growing at this rate in retail right now: paid search impressions, paid social CPMs at constant audience size, organic search clicks (which are in actual decline in many categories due to AI Overviews), referral traffic from traditional publishers, or email marketing reach. There is no major acquisition channel in retail growing in triple digits year-over-year. AI is the only one.
And it is doing this off the back of consumer behavior that is now common enough to call mainstream. More than one in three U.S. shoppers used an AI Assistant during the 2025 holiday season. About half of those used AI specifically for holiday shopping. 47% of consumers report trusting AI Assistants for shopping. 64% say they're using AI more than they used to. 65% are more confident in their purchase after using AI. And the kicker for any operations leader reading this: 68% say they are less likely to return the product when they bought it on AI's recommendation. AI is not just sending you more visitors. It is sending you visitors who buy more, return less, and trust the buying decision more than buyers acquired through any other route.
The Six Numbers That Define the Story
If a retail acquisition team wants a single slide that captures what's happening, it's these six numbers, all measured during the November–December 2025 window against non-AI sources on the same sites:
Conversion rate: +31% (Thanksgiving +54%, Black Friday +38%)
Revenue per visit: +32% (after running –51% just twelve months earlier)
Bounce rate: –33% (the gap has stayed consistently wide all year)
Time on site: +45% (longest gap on record in the Adobe series)
Page views per visit: +13% (AI sessions are not only longer, they're deeper)
Year-over-year volume growth: +693%
Run that list in front of any retail performance marketing leader and watch what happens. If you're acquiring traffic at a CAC of $X with paid search delivering RPV of $Y, and a separate cohort is delivering RPV of $1.32Y at no incremental media cost, every dollar of efficient growth in your plan should be flowing toward understanding, measuring, and earning more of that cohort. In most retail dashboards today, that cohort is technically visible — it's sitting in the Referrals channel in GA4 alongside affiliate traffic and inbound links from publisher coverage — but it isn't being looked at as the peer of paid search that the numbers say it is.
The cost of leaving the cohort un-isolated isn't that you can't allocate against it. It's that you don't even see the question.
Why the Inversion Happened
It is worth pausing on why the metrics flipped so completely in twelve months, because the mechanism explains why this is not a fad and not a measurement artifact.
The simplest version: at the start of 2025, AI Assistants were still being used the way Google was used in 2001 — as a fast search interface for a specific query. The traffic was thin and casual; the user wasn't far along the journey; the conversion rate reflected that. By late 2025, AI Assistants had become the place consumers go to do the research stage of a purchase. Adobe's consumer survey finds that 45% of consumers now turn to AI for inspiration before they begin shopping, and 41% of AI shoppers begin their session inside the LLM rather than on a retailer's site.
Read that again: nearly half of AI shoppers are not arriving on your site via the AI — they are starting on the AI, doing the research there, and then arriving on your site after the model has handed them a shortlist. The user who clicks through is a different person than the user who searches a keyword. They have:
Defined the use case (the prompt typically contains 30–100 words of context, vs. 2–4 in a keyword)
Considered alternatives (the model surfaced 3–6 options before they picked one)
Read the synthesized comparison (the AI presented pros and cons inline)
Already filtered out obvious mismatches (the AI did the filtering)
In other words, by the time the visit happens, the AI has done what your paid funnel used to do: awareness, consideration, shortlisting. The retailer's site is no longer the discovery surface. It is the conversion surface. Of course the conversion rate is 31% higher. Of course the time on site is longer — the pages they're spending time on are checkout-adjacent pages, not category-explore pages. Of course the bounce rate is lower — they didn't arrive to evaluate whether you're a match; they arrived because the AI told them you are.
This is the part of the story I think is structurally important and not going to reverse. The pre-qualification mechanic is intrinsic to how LLM-mediated shopping works. As long as consumers are using AI Assistants as a research layer, the traffic those Assistants refer downstream will be denser in intent than traffic from any source that doesn't do that pre-qualification work. The specific numbers — 31% conversion lift, 32% RPV lift — will move quarter to quarter. The structural advantage of the cohort will not.
Who the AI Shopper Actually Is
The other thing worth understanding, because it determines how you should think about your CAC math, is who the AI shopper is demographically.
Adobe's data is unambiguous: AI adoption in retail concentrates in high-income, urban, ethnically diverse, professionally affluent households. The states leading the curve are Virginia, Washington, New York, Massachusetts, and California — engagement up to two times the U.S. average. The states lagging — Mississippi, West Virginia, Louisiana, Kentucky, Arkansas — trail at less than half the national average, and the gap is driven not by internet access (which is roughly comparable) but by exposure and awareness.
At the consumer level: 80% of urban consumers are familiar with AI Assistants, vs. 67% in rural. 48% of urban consumers have used AI for online shopping, vs. 27% in rural. 57% of Asian or Pacific Islander consumers have used AI for shopping, vs. 35% of White consumers. And — the variable most relevant to a CAC model — high-income states now account for 52% of all U.S. AI traffic, up 5 percentage points since January 2025 alone. Mid-income states are at 28%. Low-income at 20%, and the gap is widening, not narrowing.
If your customer file skews toward those high-income, urban, ethnically diverse buyers — and for many premium and considered-purchase retailers it does — then AI traffic is over-indexing on exactly the segment whose attention is already the most expensive to buy on every other channel. The arbitrage opportunity here is enormous and the window is, in my reading, narrow.
What This Means for Retail Paid Marketing Teams
Five things, in priority order, that should be on the desk of every retail acquisition leader between now and Q3.
1. Build a proper AI traffic report in GA4 (or your analytics platform of choice). AI-referred traffic is in your data — it lands in the Referrals channel from chat.openai.com, www.perplexity.ai, gemini.google.com, claude.ai, and the rapidly multiplying ChatGPT-search-result URLs. The default channel grouping doesn't break it out as a peer to paid search and organic. Build a custom channel grouping, custom segment, or Looker Studio dashboard that does. This is roughly an afternoon's work for a savvy analyst and it is the single highest-leverage measurement change a retail team can make this quarter. The conversation in next quarter's planning meeting changes meaningfully once everyone can see the numbers in a single view.
2. Benchmark against paid search, not against organic. AI traffic is high-intent, pre-qualified, bottom-funnel. Comparing it to your organic baseline will make it look strong but for the wrong reason. Comparing it to your paid search performance — the channel it most resembles in intent density and conversion behavior — will reveal that you are getting paid-search-quality traffic at no media cost. That is the comparison that changes resource allocation.
3. Audit your category presence in major LLMs. If 45% of your category's shoppers are doing their consideration phase inside an LLM, the question of whether the LLM is recommending your products in answers to category-level prompts has just become a load-bearing question for your top-of-funnel performance. The discipline of getting cited — Answer Engine Optimization — is what answers that question. If your SEO team isn't already working on it, this is the meeting they should be in.
4. Take attribution seriously. A significant share of AI-referred visitors convert immediately, and your dashboard will capture them. Another significant share enter a multi-touch journey — they get a recommendation from ChatGPT, they don't convert that session, they come back via a Google search, they convert there. Standard last-click attribution credits Google. The AI Assistant that actually shaped the decision gets nothing. Until your attribution model accounts for AI as an upstream influencer rather than just a last-touch source, the real contribution of AI traffic to your funnel is, on most setups today, systematically understated.
5. Watch the return-rate data. The 68% lower return rate on AI-assisted purchases is, in my view, the most under-discussed number in the entire Adobe report. For a retail business, returns are a margin issue — a higher AI traffic mix doesn't just lift revenue, it lifts net contribution. If you can measure return rate by acquisition source, do it. The case for AI traffic gets even stronger when you net out reverse logistics.
What's Next
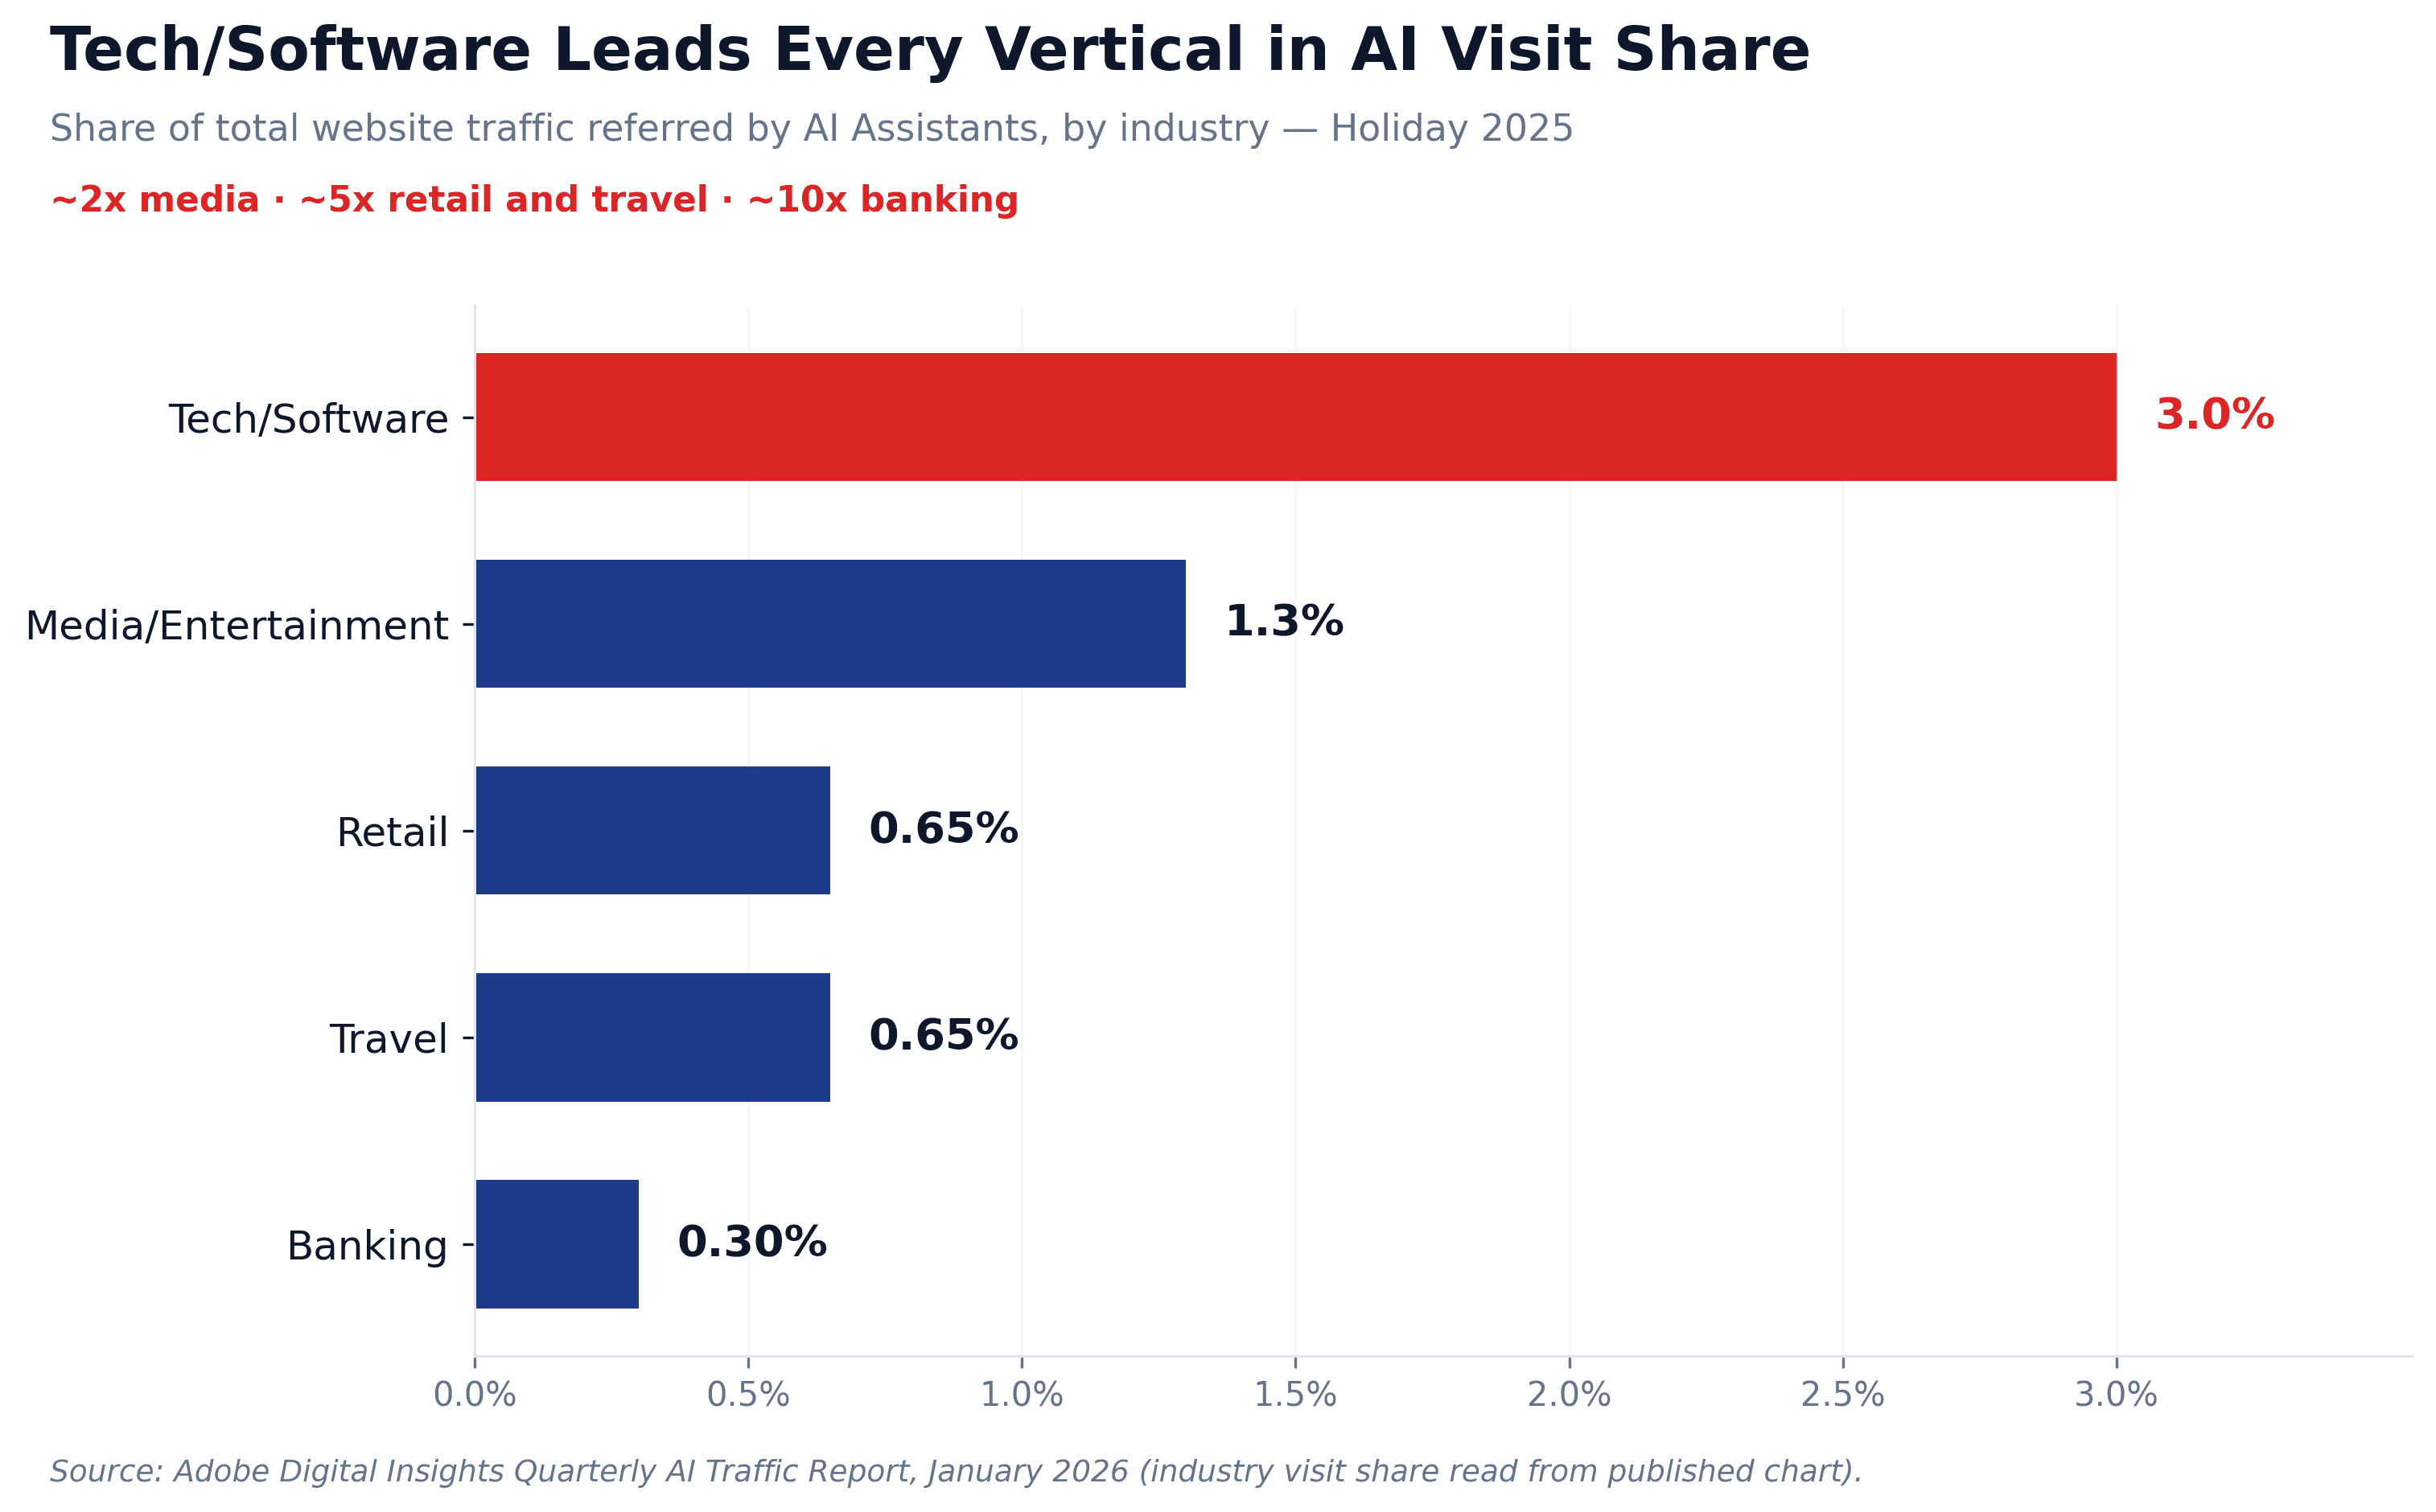
The retail story is the most dramatic story in the Adobe data, but it is not the only story — and in some ways it is the least extreme one. The engagement gaps in tech and software are wider. The trust gaps in financial services are weirder. The media-and-entertainment shift is the one most likely to reshape advertising itself.
Next post: Tech and Software. Why the engagement gap between AI and non-AI traffic in tech (35% higher engagement, 43% lower bounce, 46% more time, 22% more pages) is the widest in any industry — and why "AI for complex purchases" is the part of this story that's going to matter most to B2B paid marketers in 2026.
But before we get to tech, take a beat with the retail data. If you run paid acquisition for a retail business and you don't have AI traffic as a custom report you check daily by the end of next week, you will be one quarter behind where the curve is bending. The afternoon of dashboard work to fix that is, on my reading of the Adobe numbers, the highest-leverage hour of analyst time on offer in retail measurement right now.
The cohort has a chart. It has a six-number summary. It is sitting in your Referrals channel waiting to be looked at properly. The work is to put it on the dashboard, give it an owner, and let the numbers do the rest of the arguing.
Data throughout this post is drawn from the Adobe Digital Insights Quarterly AI Traffic Report (January 2026). The "75–85% below" October 2024 figure is read from the monthly RPV chart on page 12 of the report; the –51% figure refers to Holiday 2024 (November–December). Corroborating context on AI traffic scale is available from Cloudflare Radar, Similarweb, and Gartner.
Next in this series: AI Traffic in Tech and Software — The Widest Gap in the Data.