Productivity
Tech and Software: AI Traffic's Leading Indicator

Rishan Chopra
Founder
If you want to see what AI traffic looks like at maturity — what the curve flattens into, what the cohort behaves like once the novelty wears off, what every other vertical is converging toward — you don't look at retail.
You look at tech and software.
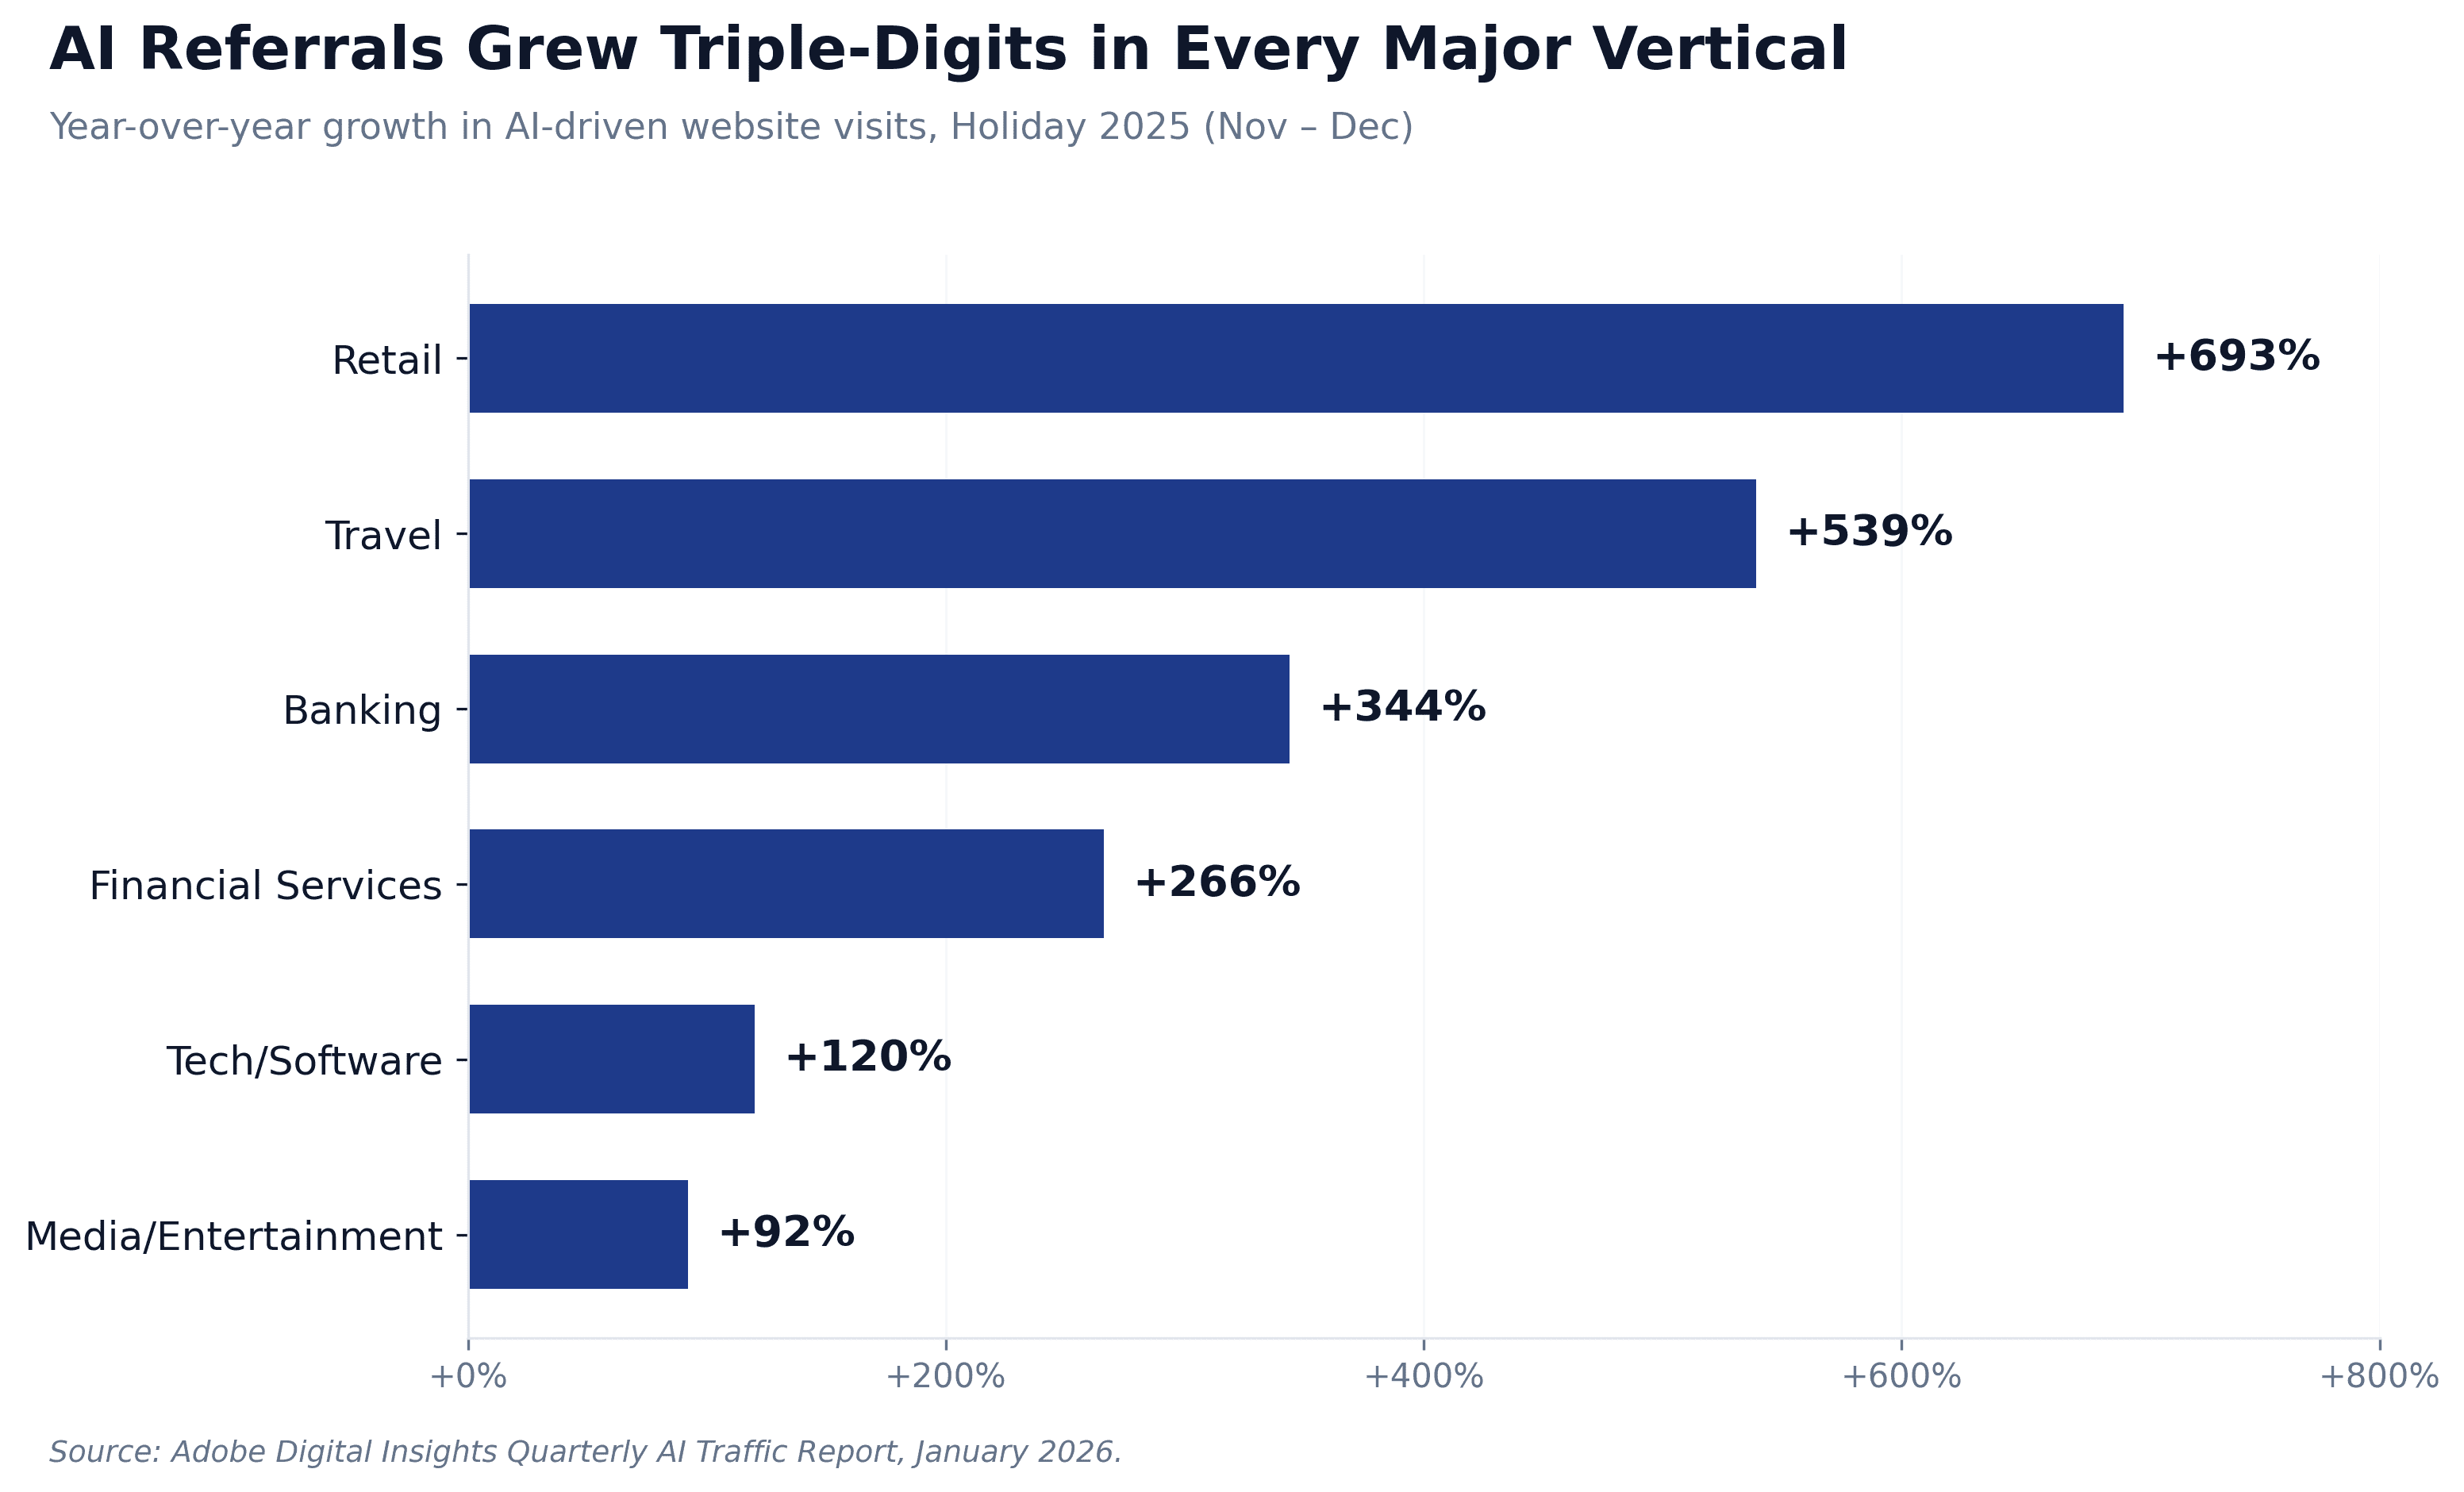
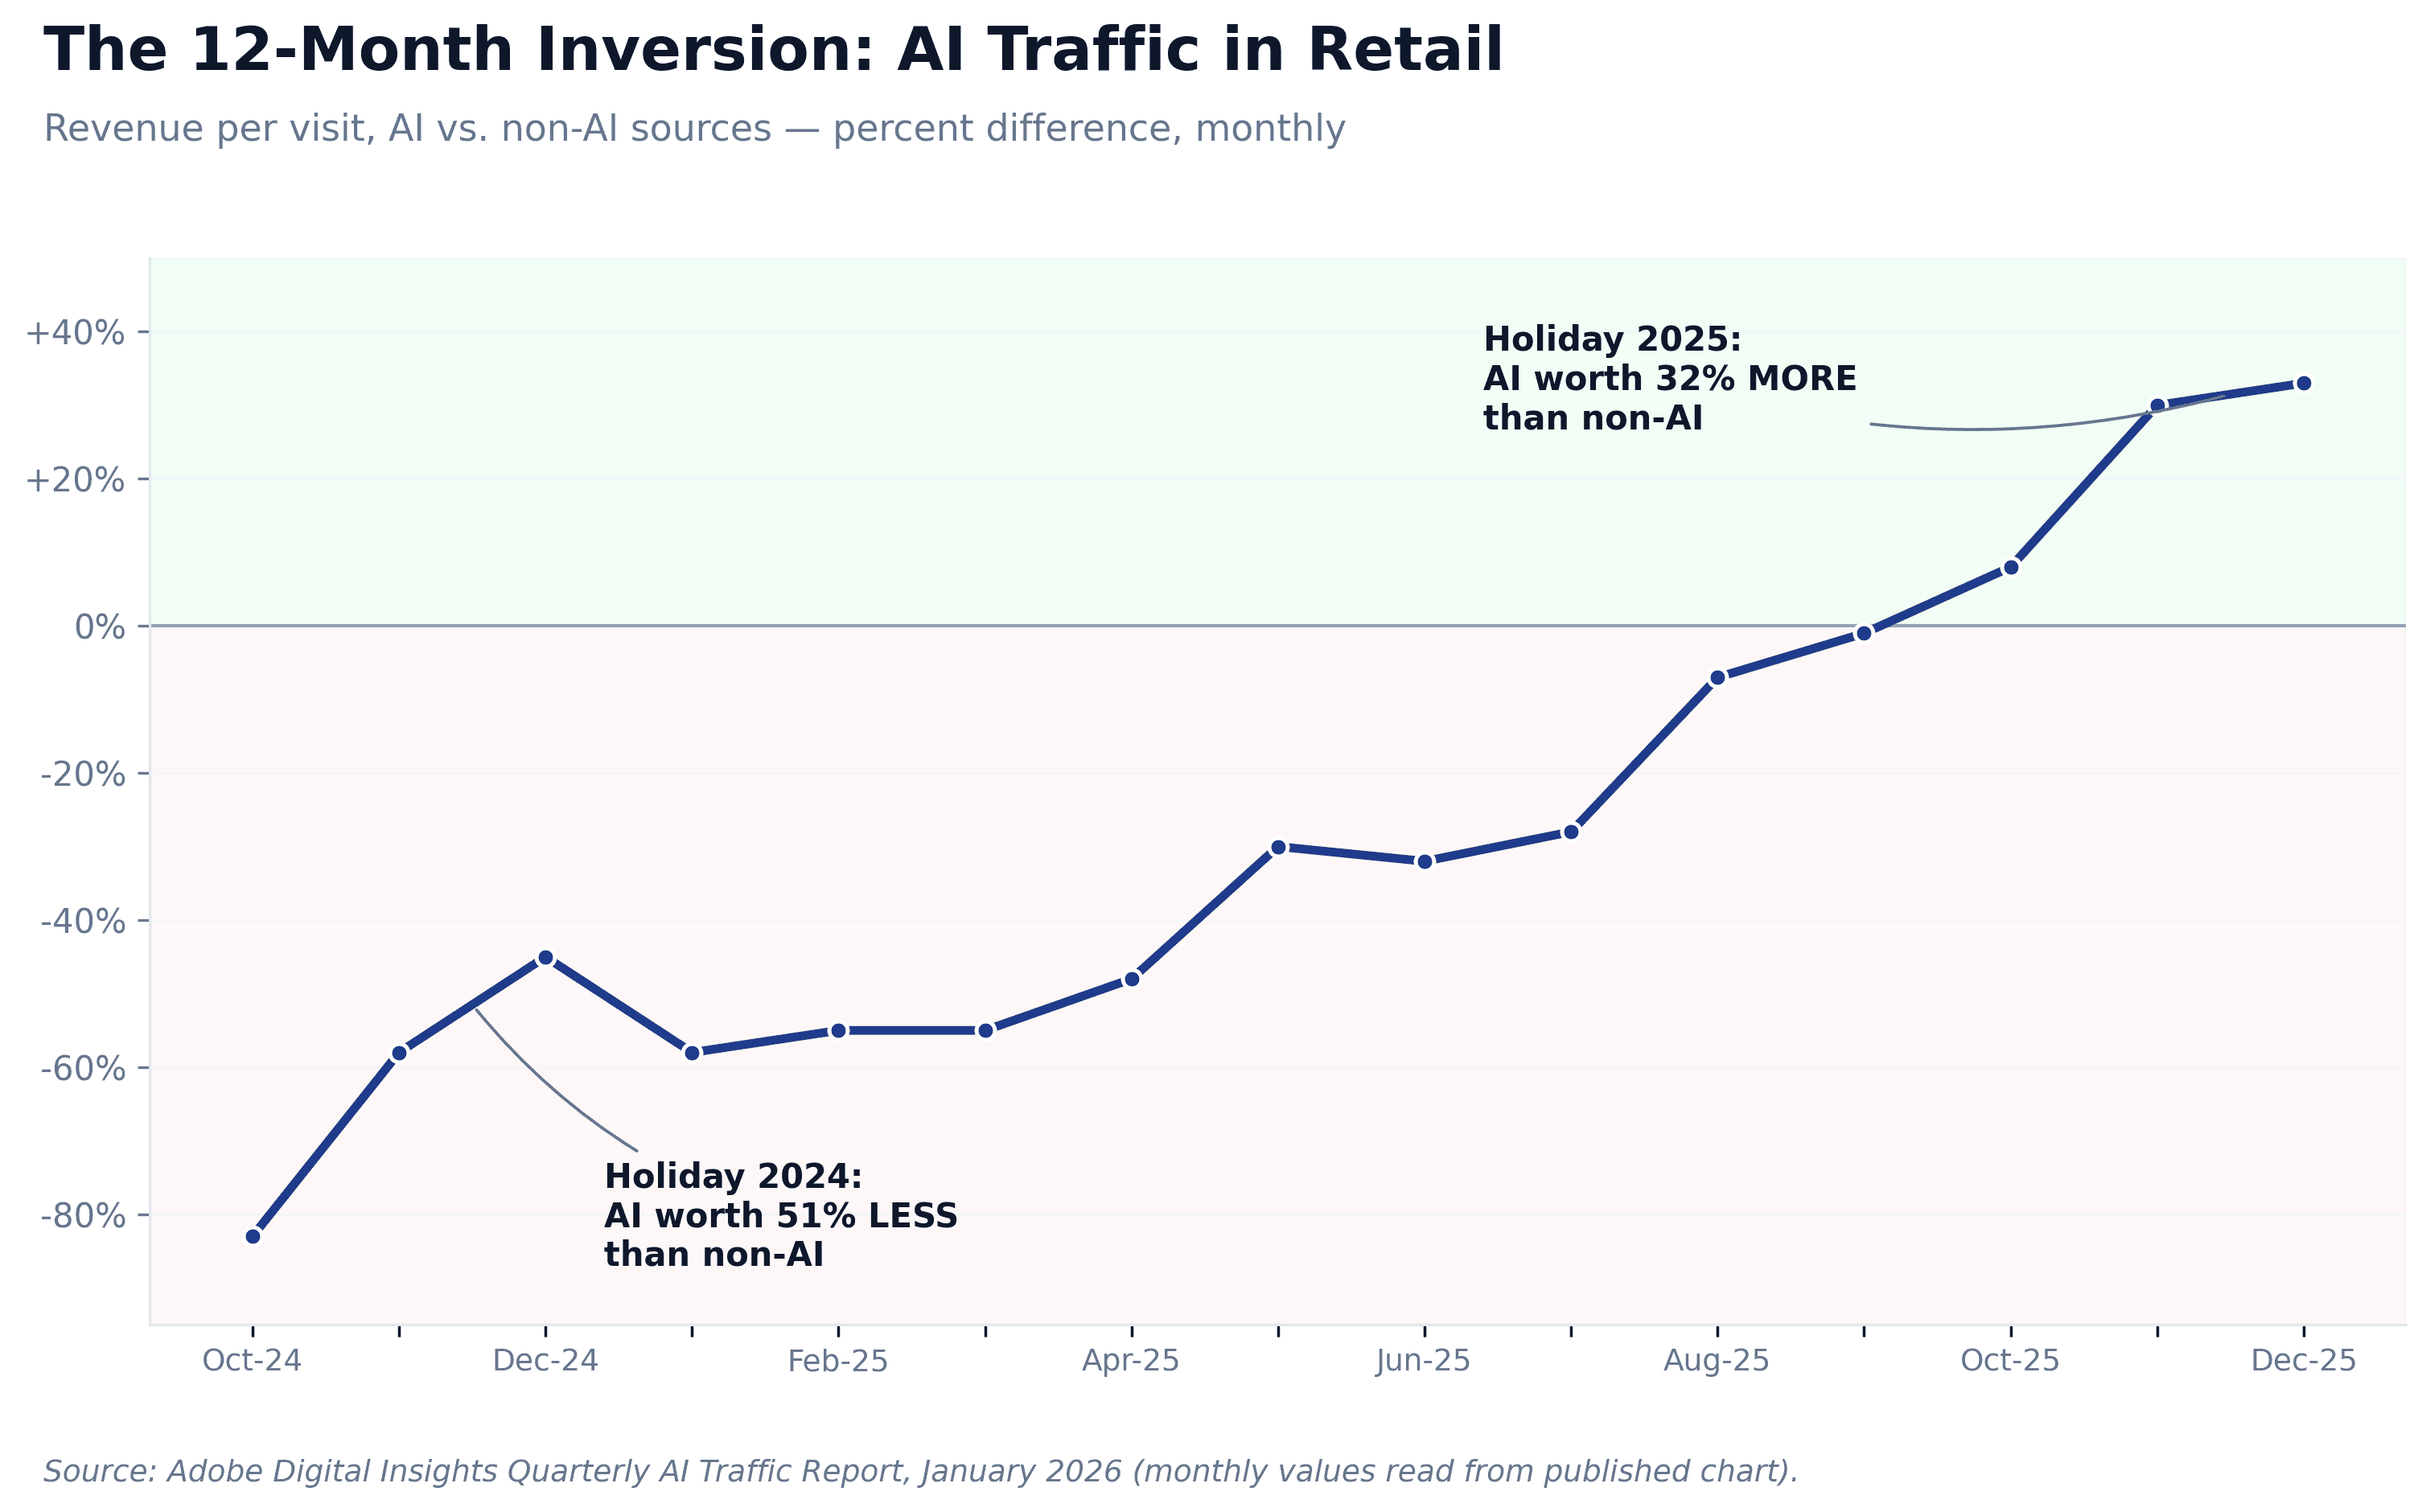
The retail story, which I unpacked in Part 2 of this series, is the most dramatic AI traffic story in the Adobe data. The 12-month inversion from –51% RPV to +32% RPV is the kind of single-year movement retail measurement has never seen before. But the retail story is dramatic because it's a story of change. Retail is a vertical that the AI cohort entered late, then rocketed through, and the curve is still bending.
Tech and software is a different kind of story. It's a story about what the curve looks like after it bends. The vertical was already further along the AI adoption curve at the start of 2025 than anyone else, and by Holiday 2025 it had the highest AI-driven visit share of any industry Adobe measures, the widest engagement gap between AI and non-AI traffic of any industry Adobe measures, and the most fully-formed AI buyer behavior in the dataset.
This is the leading-indicator argument I want to make in this post. Tech and software is not just another vertical with a strong AI traffic story. It is the vertical that is showing the rest of us what AI traffic is — once the volume has scaled, the trust has formed, and the buyer has learned how to use the model. The numbers from retail, travel, financial services, and media in 2025 are all moving toward the place tech and software was already standing in 2024.
If you're a paid marketer in any other vertical and you want to know what your own dashboard will look like in 18 months, the answer is in the tech/software section of the Adobe report.
The Highest Share of Any Vertical
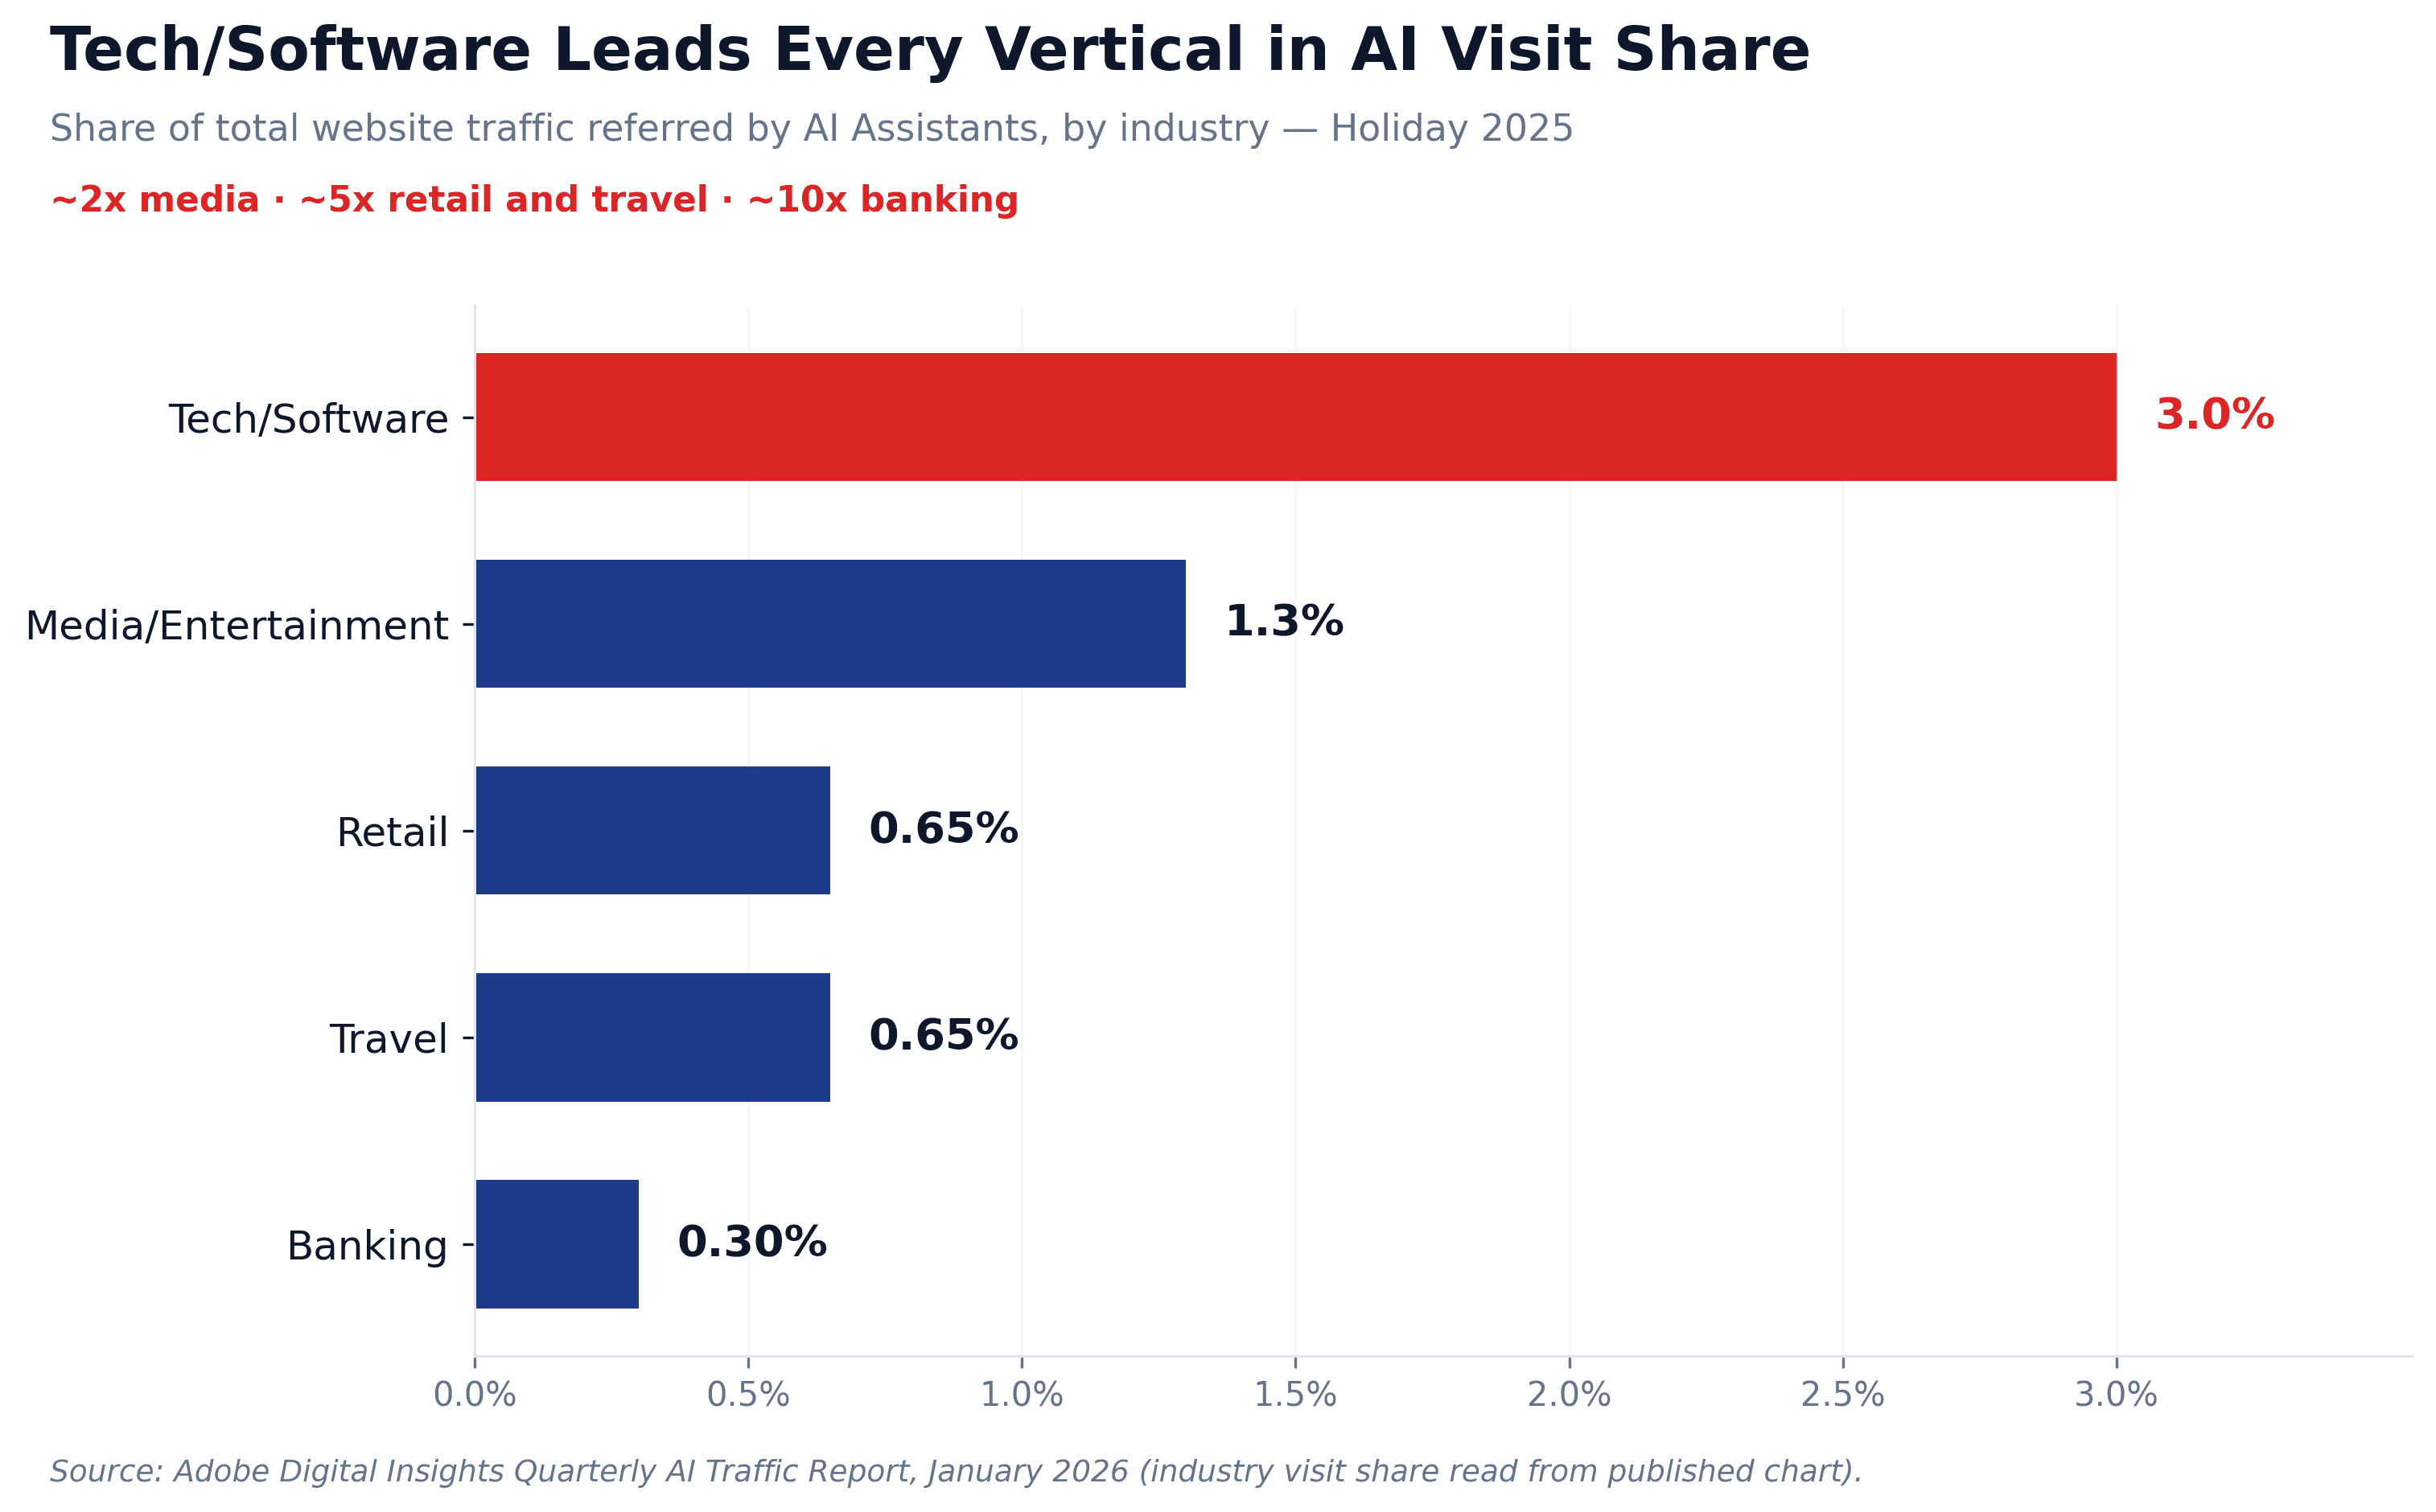
The single most arresting visualization in the Adobe report is the Visit Share by Industry chart on page 40. It's a simple bar chart of how much of each industry's total website traffic came from AI Assistants during Holiday 2025.
The numbers:
Tech/Software: ~3%
Media/Entertainment: ~1.3%
Retail: ~0.65%
Travel: ~0.65%
Banking: ~0.3%
Tech and software has more than double the AI visit share of media, around five times retail and travel, and roughly ten times banking. While retail was busy generating its 693% YoY growth rate, tech was busy operating at a level of AI traffic mix that retail will need until at least 2027 to reach — and arguably won't reach without a behavioral shift on the consumer side.
This is the part of the story I want paid marketers in every industry to internalize. The headline growth rates in retail look enormous because they're calculated off a small base. The headline visit share in tech looks moderate because it's calculated off a base that has already grown. Both are pictures of the same underlying shift, taken at different points in the adoption curve. Tech is just further along.
Growth in tech AI traffic was +120% year-over-year in Holiday 2025 — slower than retail's 693%, but compounding off a meaningfully bigger starting point. From July through November 2025, AI visit share in tech sat on a sustained high plateau, suggesting the vertical has reached the point where AI traffic is no longer a novelty cohort but a structural component of the acquisition mix.
For a tech or SaaS paid marketing leader, the practical implication is simple: AI is already around 3% of your visit volume, and the cohort is sitting in your Referrals channel waiting to be reported on as its own line. That's not a 2026 forecast. That's the floor today. Two years from now, applied at the growth rates Adobe is reporting, the figure will not be small.
The Widest Engagement Gap in Any Industry
Volume is the smaller part of the story. The bigger part is quality.
During Holiday 2025, AI-driven visits to tech and software sites had a 35% higher engagement rate (visits minus bounces) than non-AI sources. That is the largest engagement gap of any industry Adobe measures — wider than retail (14%), wider than travel (16.8%), wider than media (12%), and wider than financial services (8.3%).
Said differently: when an AI Assistant refers a visitor to a tech/software site, that visitor is dramatically more likely to stay than a visitor referred from any other source. They don't bounce. They don't browse for thirty seconds and leave. They engage.
The supporting numbers are equally striking:
Bounce rate: 43% lower than non-AI sources (the widest gap in the dataset)
Time on site: 46% longer per visit
Page views per visit: 22% higher
The Adobe report reads these numbers as evidence that "users are relying on AI for research and discovery in complex, fast changing areas." That's right, and worth saying explicitly. AI Assistants are at their most useful when the underlying purchase is complex. A consumer choosing between two streaming services or two pairs of jeans does not need much synthesis. A consumer — or a small business buyer, or a developer, or an IT manager — choosing between two cybersecurity vendors, two analytics platforms, or two cloud providers absolutely does. The denser the consideration set, the more the model earns its keep.
This is why I think the tech/software engagement gap is a leading indicator. It's not that tech buyers are unusual. It's that tech purchases are unusually well-suited to AI Assistance. As AI Assistants continue to improve their handling of complex consideration sets, the gap will widen in other complex-purchase verticals — financial products, healthcare, B2B services — to look more like what tech already looks like.
Who the Tech AI Shopper Is
The Adobe consumer survey breaks down tech-AI usage in ways that paid marketers in this vertical should pay attention to.
48% of consumers report using AI to understand, troubleshoot, or make decisions about tech products and services, with another 62% intending to do so in the near future. That's not a niche behavior. That's a majority of the buying universe.
Of those who have made a tech/software purchase with AI's help (28% of consumers, on Adobe's measurement), the categories break down like this:
Electronics: 37%
IT and Cloud Software: 14%
Cyber Security Software: 9%
Analytics and Infrastructure Tools: 6%
Read those four numbers carefully. Electronics is the largest because the population of people buying consumer electronics is much larger than the population of people buying cybersecurity software. But the presence of IT and cloud software, cybersecurity, and analytics on the list at all is what matters most. These are B2B-coded purchase categories. The buyers of cloud software, security tools, and analytics platforms are not typically researching their next vendor by searching keywords on Google. They are increasingly asking ChatGPT or Perplexity "what's the best [category] for [use case]," reading the synthesized comparison, and then clicking through to the candidate vendors that the model surfaced.
For B2B SaaS marketers, this is the most important sentence in this entire essay: the LLM is now the top of your funnel for a meaningful and rapidly growing share of high-intent buyers. Adobe's measurement framework is a consumer-survey lens on a phenomenon that, in B2B, is in some ways even more advanced — because B2B buyers are disproportionately AI-native (they work in tech, use AI tools at work, and are paid to evaluate complex tools efficiently). The full B2B picture isn't in the Adobe report, but the consumer-survey signal points clearly at it.
Adobe's industry-by-industry consumer survey adds one more data point that anchors all of this: in the technology industry specifically, only 1% of consumers have never heard of AI Assistants, 69% have used them for online shopping, and 80% plan to use them this year. The single largest reported driver of AI use among tech consumers is company adoption — 36% report that company AI adoption shapes their personal use.
In other words: AI traffic in tech and software is being driven by buyers whose employers have already normalized AI tools at work, who use those tools daily, and who naturally bring that workflow into their personal and professional purchase decisions. There is no consumer-education curve to wait for in this vertical. It already happened.
Why the Gap Persists
A reasonable question to ask of the Adobe data is whether the engagement gap is a transient feature of a small, self-selecting cohort, or a structural feature of how AI-mediated buying actually works.
The chart on page 42 is the clearest evidence the gap is structural. The percent-difference in time-on-site between AI and non-AI traffic in tech/software has trended upward all year — from roughly 14% in October 2024, through 19% in late 2024, through the mid-teens in early 2025, up to a peak of 53% in October 2025, settling at 46% during Holiday 2025. The trajectory is up and to the right across thirteen months of monthly data. The page-views-per-visit gap follows the same pattern.
If the engagement gap were a small-cohort artifact, you'd expect it to shrink as the AI cohort grew — the cohort would average out toward the broader behavior of the rest of the audience. It is doing the opposite. It is widening as the cohort grows. That tells you the additional visitors arriving via AI in 2025 are behaving more like high-intent buyers, not less.
The most likely explanation is the one I argued in Post 2: AI Assistants are doing the research stage of the purchase journey on behalf of the buyer. In tech and software, the research stage is genuinely long and genuinely valuable — anyone who has tried to evaluate three SaaS vendors, three analytics tools, or three cloud providers knows this. The AI is compressing weeks of comparison into a single conversation. The visitor who lands on your product page has had the equivalent of a senior analyst's recommendation in their pocket when they arrived.
That is not a transient phenomenon. That is what the future of buying complex products looks like.
What This Means for Tech and SaaS Paid Marketers
Five things, in priority order, that should be on the desk of a tech/software acquisition leader in 2026.
1. Build a proper AI traffic report against your existing analytics. Adobe's measurement says AI is around 3% of total visits in the vertical, but it's the highest-converting and most engaged 3% on your site. Your GA4 (or equivalent) is already capturing the referrers — chat.openai.com, www.perplexity.ai, gemini.google.com, claude.ai, plus a growing list of ChatGPT-search-result URLs. The default channel grouping rolls them into Referrals. Build a custom channel, custom segment, or Looker Studio view that breaks the cohort out as a peer to your paid channels. This is the single highest-leverage measurement change a tech or SaaS team can make this quarter, and it changes the conversation in the next planning cycle.
2. Audit your category presence in major LLMs — and audit it monthly, not annually. If your buyers are starting their consideration phase inside an LLM, the question of whether the model recommends your product in answers to category-level prompts has become a load-bearing question for your top-of-funnel. Run the prompts your buyers would run. Read the answers. Identify whether you're cited, how you're characterized, what competitors are surfaced ahead of you, and whether the citations point to the strongest content on your site or to a Wikipedia-tier summary. This work is what AEO (Answer Engine Optimization) is converging on, and in tech and software it is no longer a nice-to-have.
3. Stop assuming SEO and AEO are the same problem. The content that ranks well in Google is not the same content that gets cited by an LLM. Google rewards comprehensive, freshness-tuned, keyword-dense pages. LLMs reward content that is quotable — short, direct, attributable, and structurally clear. If your content team is producing 3,000-word comprehensive guides because that's what ranks, you are likely producing content that gets dismissed by the model in favor of a Stack Overflow answer or a competitor's documentation page. Rebuild the content roadmap with AEO-specific signal in mind.
4. Re-examine your free-trial and demo-CTA economics. If 22% more pages per visit and 46% more time on site are the structural pattern of AI-referred traffic, then the funnel inside your site looks different for this cohort. They're not bouncing past your product page; they're reading documentation, comparing pricing, watching the demo video. The conversion paths your CRO team optimized against traditional paid-search visitors may be the wrong paths for the AI cohort. Run the analysis. The CRO opportunity here is unusually large because the cohort is unusually patient.
5. Take attribution seriously — and get ready for a bigger conversation about it. A meaningful share of AI-referred buyers convert immediately on the click and your dashboard catches them. Another meaningful share enter long, multi-touch B2B-style journeys where the AI Assistant shaped the consideration set, the conversion happened months later via a direct visit or branded search, and standard last-click attribution credits the wrong source. Until your attribution model accounts for AI Assistants as upstream influencers rather than just last-touch sources, your reading of the cohort's real contribution will be systematically conservative. This is where the measurement story is heading next, and it's a problem that won't be fully solved with a custom GA4 segment alone.
What's Next
The tech and software story is the leading-indicator story. The retail story (Post 2) is the dramatic-change story. The next vertical in this series — financial services and banking — is the trust story, and it's the one I find the most quietly interesting in the entire Adobe report.
Next post: Financial Services and Banking. Why 85% of consumers say they trust AI to make financial recommendations without human input, why nearly half of those follow the advice in full, and what it means for a category of paid marketing — financial services — where trust has always been the moat. The answers complicate every assumption about high-consideration purchases that the previous fifty years of financial marketing has been built on.
If you're a paid marketer in tech or SaaS, though, take a beat with this post first. You are operating in the vertical where the AI traffic story is most fully formed. The frameworks you build in your dashboard now will be the ones every other vertical's acquisition team will be asking to borrow in eighteen months.
Data throughout this post is drawn from the Adobe Digital Insights Quarterly AI Traffic Report (January 2026), pages 38–42 and consumer survey data referenced therein. The Visit Share by Industry chart referenced is on page 40. B2B-specific inferences are drawn from the consumer-survey signal in Adobe's data plus broader behavioral evidence on AI-tool adoption in tech-sector workplaces; the Adobe report itself does not separately segment B2B from B2C purchase behavior.
Next in this series: AI Traffic in Financial Services — The Trust Story.